
Lexington SC Housing Market: June 2026 MLS Area 11 Update
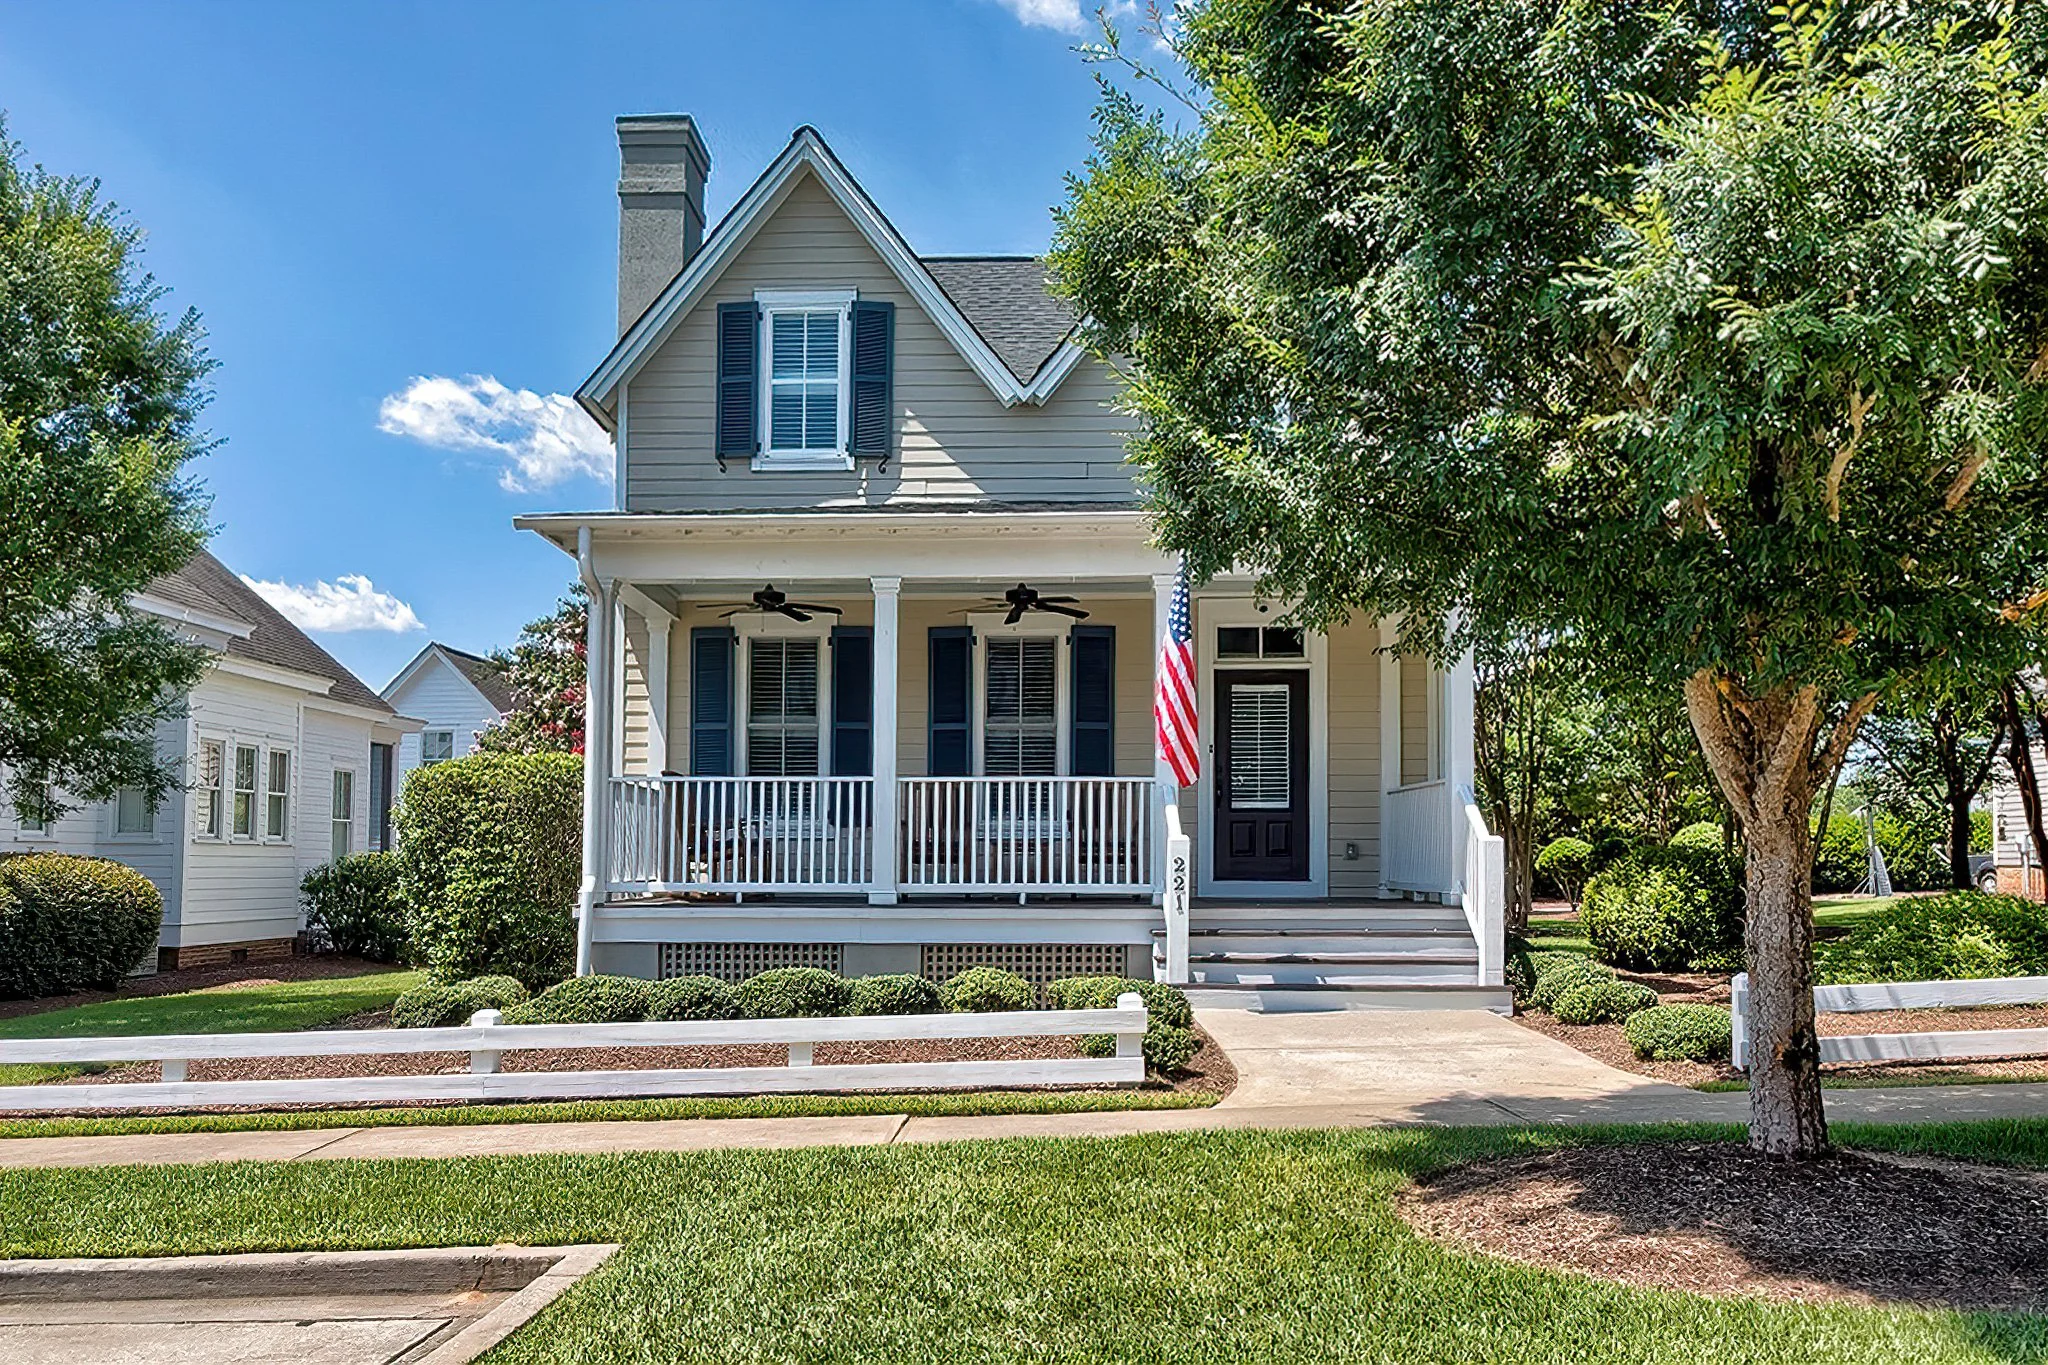
Lexington and the surrounding communities that make up MLS Area 11 are Patrick O'Connor's home market. When a family asks what homes are actually doing in town, this is the slice of the CMLS report that answers it. The June 2026 Local Market Update, current as of July 10, 2026, shows a Lexington-area market that is selling more homes, holding price, and offering buyers more choices than it did a year ago.
Here is what the numbers say, and what they mean if you are buying or selling in Lexington, South Carolina this summer.
What MLS Area 11 covers
Area 11 in the Consolidated Multiple Listing Service is labeled Lexington and Surrounding Areas. It is not Lake Murray waterfront (those lake slices sit in other MLS areas). It is the in-town and close-in Lexington market that most Midlands buyers actually tour: neighborhoods, new construction, and established streets around Lexington itself.
All figures below come from the CMLS June 2026 Local Market Update for Area 11. Median sales price and percent of list price received do not account for sale concessions or down payment assistance. Percent changes use rounded figures.
June 2026 at a glance
Closed sales in Area 11 rose in June even as new listings ticked slightly lower. Median price was essentially flat. Inventory jumped.
New listings: 251 in June 2026, down 1.6% from 255 in June 2025.
Closed sales: 228, up 7.5% from 212.
Median sales price: $315,750, up 0.2% from $315,000.
Percent of list price received: 99.1%, up 0.2% from 98.9%.
Days on market until sale: 39, up 10.6% from 36.
Inventory of homes for sale: 460, up 25.3% from 367.
That combination is the story. More buyers closed. Sellers still netted essentially full list. And there were 93 more homes sitting on the market than there were in June 2025.
What the year-to-date numbers add
The first half of 2026 looks a lot like June, just stretched across six months.
New listings: 1,500 year to date, up 6.9% from 1,403.
Closed sales: 1,062, up 4.6% from 1,015.
Median sales price: $310,000, down 1.0% from $313,000.
Percent of list price received: 99.0%, unchanged from 98.9% a year ago.
Days on market until sale: 47, up 3.7% from 46.
Year to date, Lexington is selling more homes at almost the same median, with sellers still receiving 99% of list. The June median ($315,750) sits a little above the year-to-date median ($310,000), which is typical of a stronger mid-year month rather than a price breakout.
What this means if you are buying in Lexington
A 25.3% jump in active inventory, from 367 homes to 460, is the buyer-side headline. You have more to look at than you did last June. Days on market moved from 36 to 39 in June, and from 46 to 47 year to date, so the extra supply has not turned Area 11 into a slow market. Well-priced homes are still trading.
The other buyer number that matters: 99.1% of list price received in June. Offers still have to be close to asking if the home is priced right. Use the extra inventory to be selective, not to assume a deep discount is waiting.
What this means if you are selling in Lexington
Price is holding. June median $315,750 versus $315,000 a year ago is a 0.2% change, not a slide. Year to date the median is $310,000, down 1.0% from $313,000. That is a stable market, not a distressed one.
The seller-side caution is inventory. 460 active listings is a bigger field than 367. Homes that are overpriced will feel that extra competition in those three extra days on market. Homes that are priced to the June comps, and presented well, are still closing at 99.1% of list. Pricing to the neighborhood, not to last year's peak, is how you stay in that 99% club.
Closed sales are up 7.5% for the month and 4.6% year to date. Buyers are here. They have more choices. The listings that win are the ones that look like the recent solds.
How to read these numbers without overreacting
A 10.6% increase in days on market sounds large until you remember it is three days (36 to 39). A 0.2% median-price change is $750 on a $315,000 home. Inventory up 25.3% is the one figure that should change how you tour and how you price.
The CMLS footnote is worth taking seriously: these medians do not include sale concessions or down payment assistance, and small samples can make percent changes look extreme. Area 11 is not a small sample (228 June closings, 1,062 year to date), so the direction of travel is usable. Treat any one month as a snapshot, not a forecast.
Ready to buy or sell in Lexington?
If you are weighing a Lexington move, or you want a price opinion on a specific street in Area 11, The Patrick O'Connor Team at Coldwell Banker Realty lives in this market every week. We will pull the current comps against this June snapshot and tell you plainly whether you should list, wait, or write an offer.
Ready to buy or sell? Call The Patrick O'Connor Team at 803-243-0224.